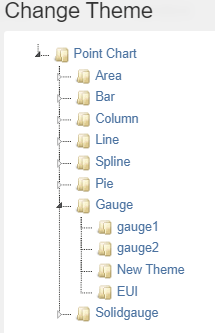
There are two basic types of charts:
- Point Charts - These are charts where multiple points are used to define each series in the chart. Available themes are line, bar, column, pie, and gauge, and each of these have multiple sub-types.
- Time Charts - These are charts where a point along with a duration of time is used to define each series. Available themes are line and category charts (i.e. bar, column, etc). If a category chart is select, the categories will be and each of these have multiple sub-types. If a line theme is displayed, the
After creating a given chart, you may later change its sub-type to another sub-type, but you may not change it from a point chart to a time chart. If a pie chart to migrated to a category chart (i.e. bar, column, etc), the data in the first series will be used as the category names. If a chart with multiple data per series is migrated to a gauge chart, only the first data point per series will be used.
You may also clone a given chart and make changes to it while preserving the original chart. Category charts are unique in that you have the option to invert the series and with series data.
Charts also can have different themes which will effect their general appearance. If you wish to virtual the chart to meet your specific needs, you may utilize the Advanced mode, however, you will need to follow instructions as described by the Highcharts documentation.

